Build a geospatial dashboard in Python using Greppo
February 24, 2022
Lack of frontend, backend and web-dev experience can be limiting in making a web-app in Python. Not anymore…
Geospatial data analytics have become a common place in data science. Beyond mapping and visualisations, it broadly consists of extracting knowledge by detecting & recognising patterns, and building models for making predictions. Python remains to be a standard among data science, and is no different for geospatial data science. The communities backing projects like GeoPandas, Shapely and Rasterio, have made Python a go-to for geospatial analytics.
As a data scientist, it is common to work with multiple stakeholders including non-technical ones. The power to distill your research outcomes into a non-technical narrative comes in very handy. It all comes down to communicating how the outcomes could benefit the stakeholders. Creating a dashboard for your Python script is an effective method of story telling. A dashboard also comes in handy when you want to share your work to external stakeholders, limiting them with only the interaction and visualisation, without sharing the internal workings.
Greppo: A quick and easy way to build geospatial dashboards.
Greppo
Greppo is an open-source Python framework for building geospatial web-apps. It provides ready to use frontend and backend components as functions that act as an API between the frontend interactive component and the bound backend variable. To understand more about the mental-model refer to this page.
TL;DR: without much frontend, backend, web-dev experience you can build and deploy a fully functional web-application with basic Python in under 5 minutes.
- GitHub repository: https://github.com/greppo-io/greppo
- Documentation: https://docs.greppo.io/
- Website: https://greppo.io/
In this tutorial we will be building a geospatial dashboard in Python using Greppo. We will work through setting up the environment, installation, importing data, putting in the components for our dashboard and serving it. You will be required to know the basics of Python, GeoPandas and geospatial analytics.
Getting started…
The first thing to do is install Python and setup your Python environment. For those who are new to this, check out this blog post to help you get started on python environments. Once you are ready with that, let’s install our dependencies.
$ pip install greppo geopandas
Download the dataset that you require for this tutorial. All the data and the code for this tutorial can be found here in this GitHub repository: greppo-demo/vector-demo (Data source: https://github.com/openpolis/geojson-italy)
Scripting the dashboard
We start with setting up the folder structure for the project. I will be using the following project folder structure:
└── vector-demo
    ├── app.py
    ├── cities.geojson
    ├── regions.geojson
    └── roads.geojson
Let’s create the Python script for the dashboard. The code for the app goes into app.py.
Step 0: Serving the app
To run and serve the app, open a terminal and follow these instructions. First, change directory (cd) into the project folder vector_demo. Once inside, activate your Python environment where you have greppo installed. I am using pyenv here in the example. To then run the app, all you need to do is run greppo serve app.py command. The command serve, starts the server and compiles the code inside the app.py, which can be renamed to any file.
Be sure to be inside the project folder where the app.py is, or use a relative folder structure such as greppo serve ./vector-demo/app.py.
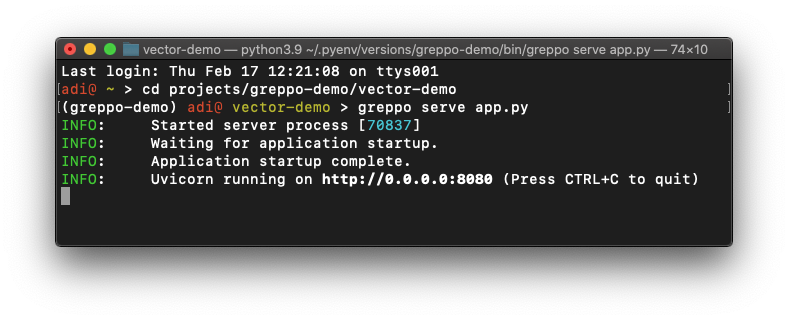
You will then see the Uvicorn server running at a specified location. Copy and paste the address in your browser. Which will then load the app. If you have made any changes to the app.py , just save the changes and reload the web-app page. Where you will see the updated changes to your app.
Step 1: Build the basic scaffolding for the app.
Which is to import the greppo package and to add the base_layer to the map.
You need to first import app from greppo . This app object will serve as the interface to to your application frontend and provide the API for 2 way communication between the front and the back-end.
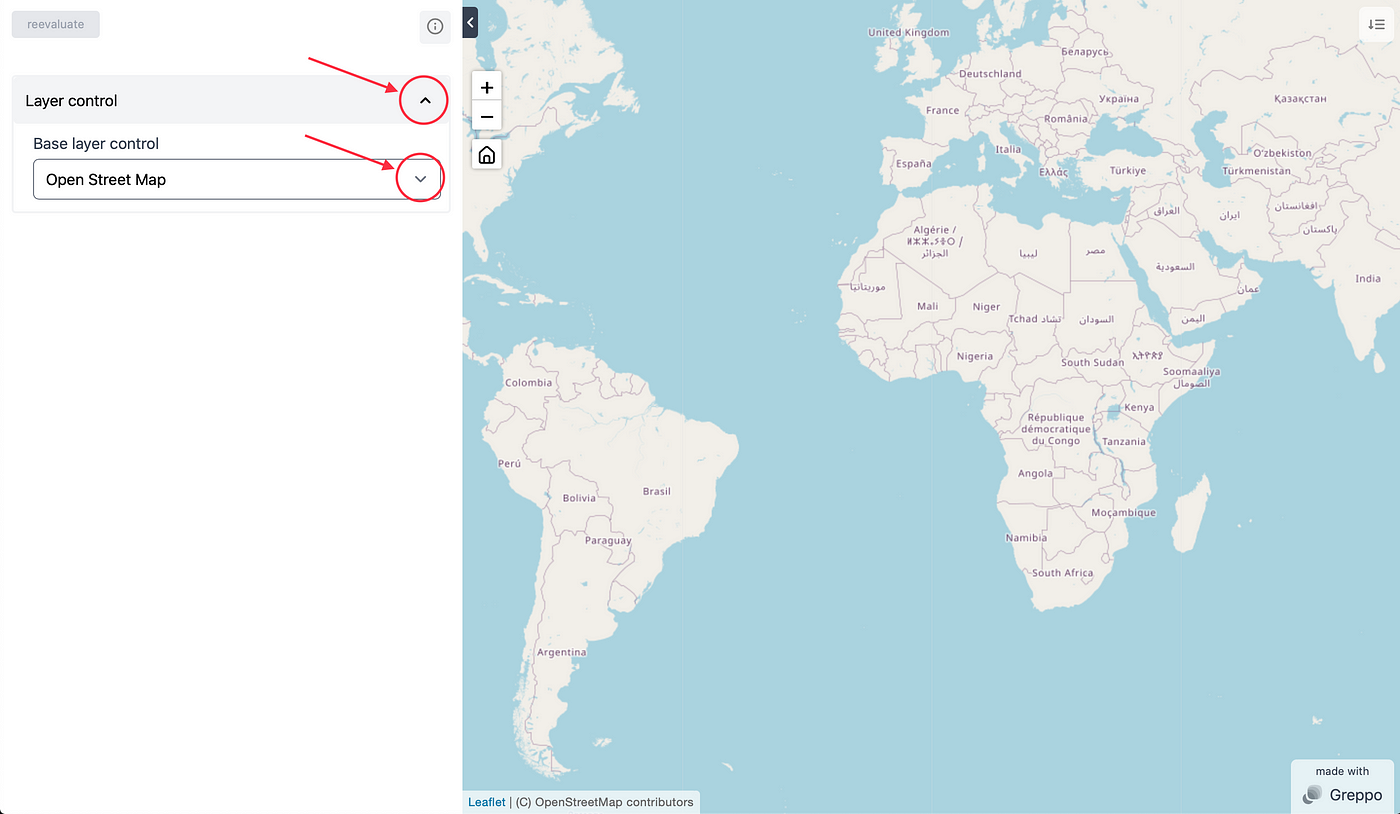
To add a base_layer to your application map, just use the app API method app.base_layer() with the required arguments. Refer to the documentation for what is required and what is optional. The base_layer method provides two ways to specify the base tile layer. One is to use the name and url attributes. The other method is to use the name of a provider. Greppo uses xyzservices under the hood for this. For a list of the provider names, check out this list here.
The provider name should be complete with its type/variety as in CartoDB Positron or OpenStreetMap Mapnik .
Step 2: Import the dataset and display it as an overlay.
Using geopandas we can import the vector dataset as a GeoDataFrame. This can then be visualised on a map on the web-application using the app.vector_layer() method.
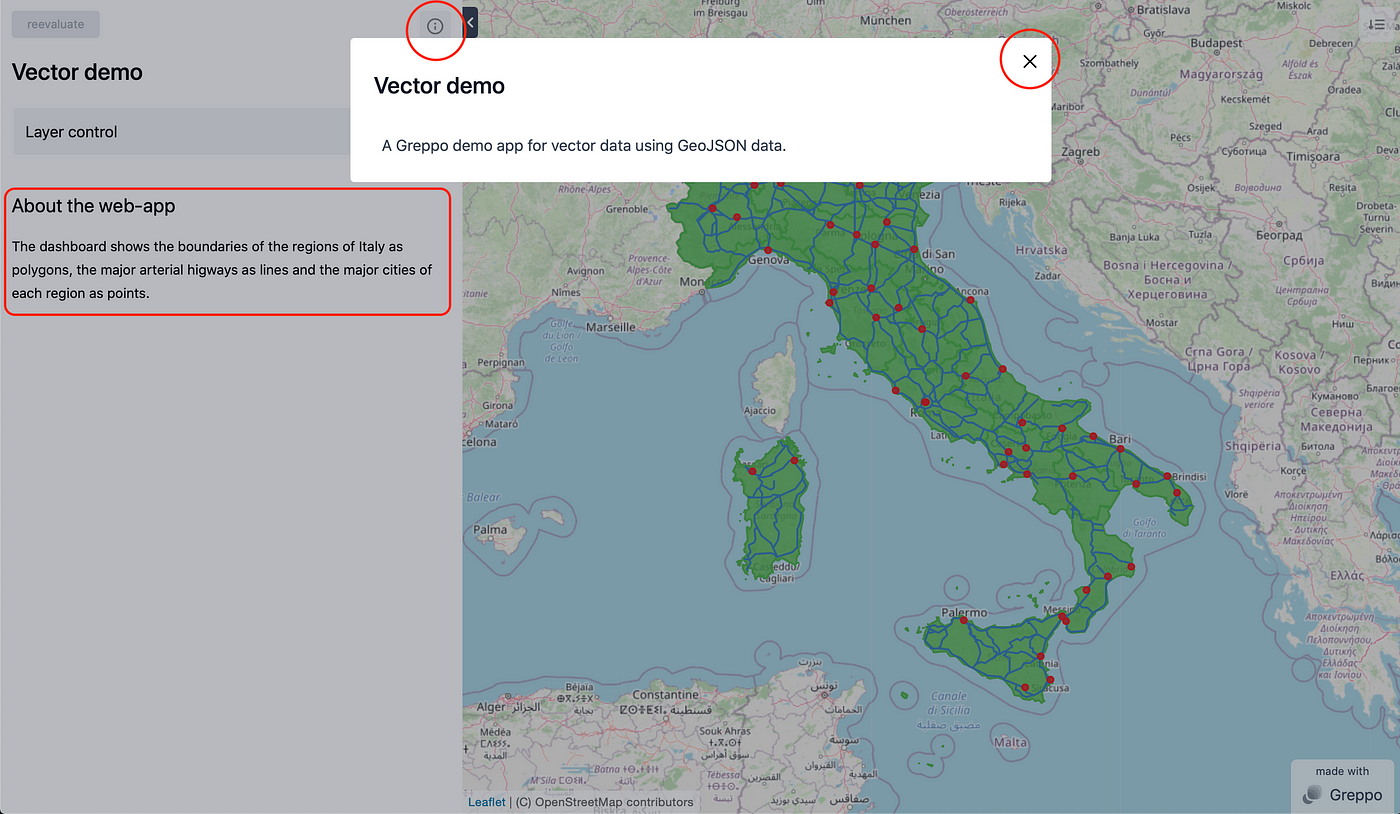
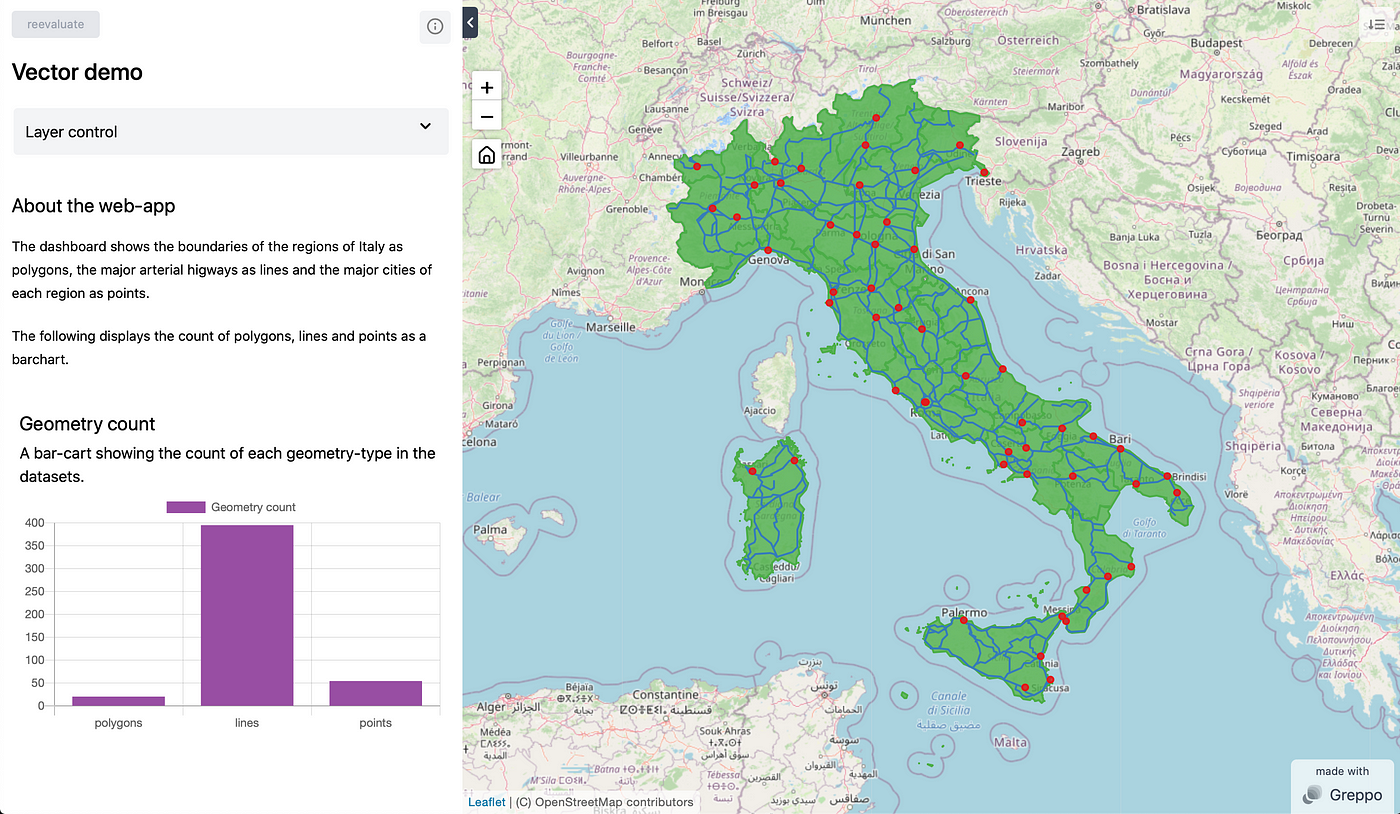
Here I am importing three different datasets one each having polygons (boundaries of the different regions of Italy), lines (major highways in Italy) and points (major cities of Italy).
Using the method app.vector_layer() as an API to the frontend we can display the vector data. You are required to pass in the name and the other parameters are optional. Although, passing in the color or fillColor to the style is a good practise to differentiate and identify each layer. Since the frontend is based on Leaflet, all the styling is accordance to the leaflet’s specification and can be found in the documentation.

You can find all the information of the vector_layer and the styling here.
You could also make a Choropleth map. Documentation of which can be found here.
Step 3: Displaying in-app text, app-title and app-description
For the web-application to be useful, it needs to carry some text to provide some guidance and context to its users. These could be displayed on the sidebar next to the components. Using the method app.display() markdown text can be displayed on the web-app. Using the same method, the title and description of the app can be set.
The app.display() takes in two arguments name and value . While value caries the text to be displayed, name has to be unique and carries the identifier to the text. If name=’title’ the value passed is the title of the app and if name=’description’ the value passed is the description of the app. Without any of the two, the app carries its default title and description. It is encouraged to set the title and description of the app.
Step 4: Displaying data as a chart
A data app is hardly without display of data as a chart. Greppo also lets you display data as charts. Information of the charts and their usage can be found in the documentation. Here, as an example a bar-chart is presented, app.bar_chart().
The required arguments for the charts are the name, x and y values. A description and a color could be added to give the app user a better context. The name and description are displayed along with the chart.
Conclusion
Let’s take complete run through what we’ve done here. Our goal was to create a geospatial web-app using Greppo, to display some GIS vector data, and add components to give the user of the app a better context. Here is the complete code for the app:
And here the output of the app:
So, there we have it. A complete web-app built using Greppo, in under 5 mins.
All the files for this demo can be found here: https://github.com/greppo-io/greppo-demo/tree/main/vector-demo
Originally posted in Towards Data Science.